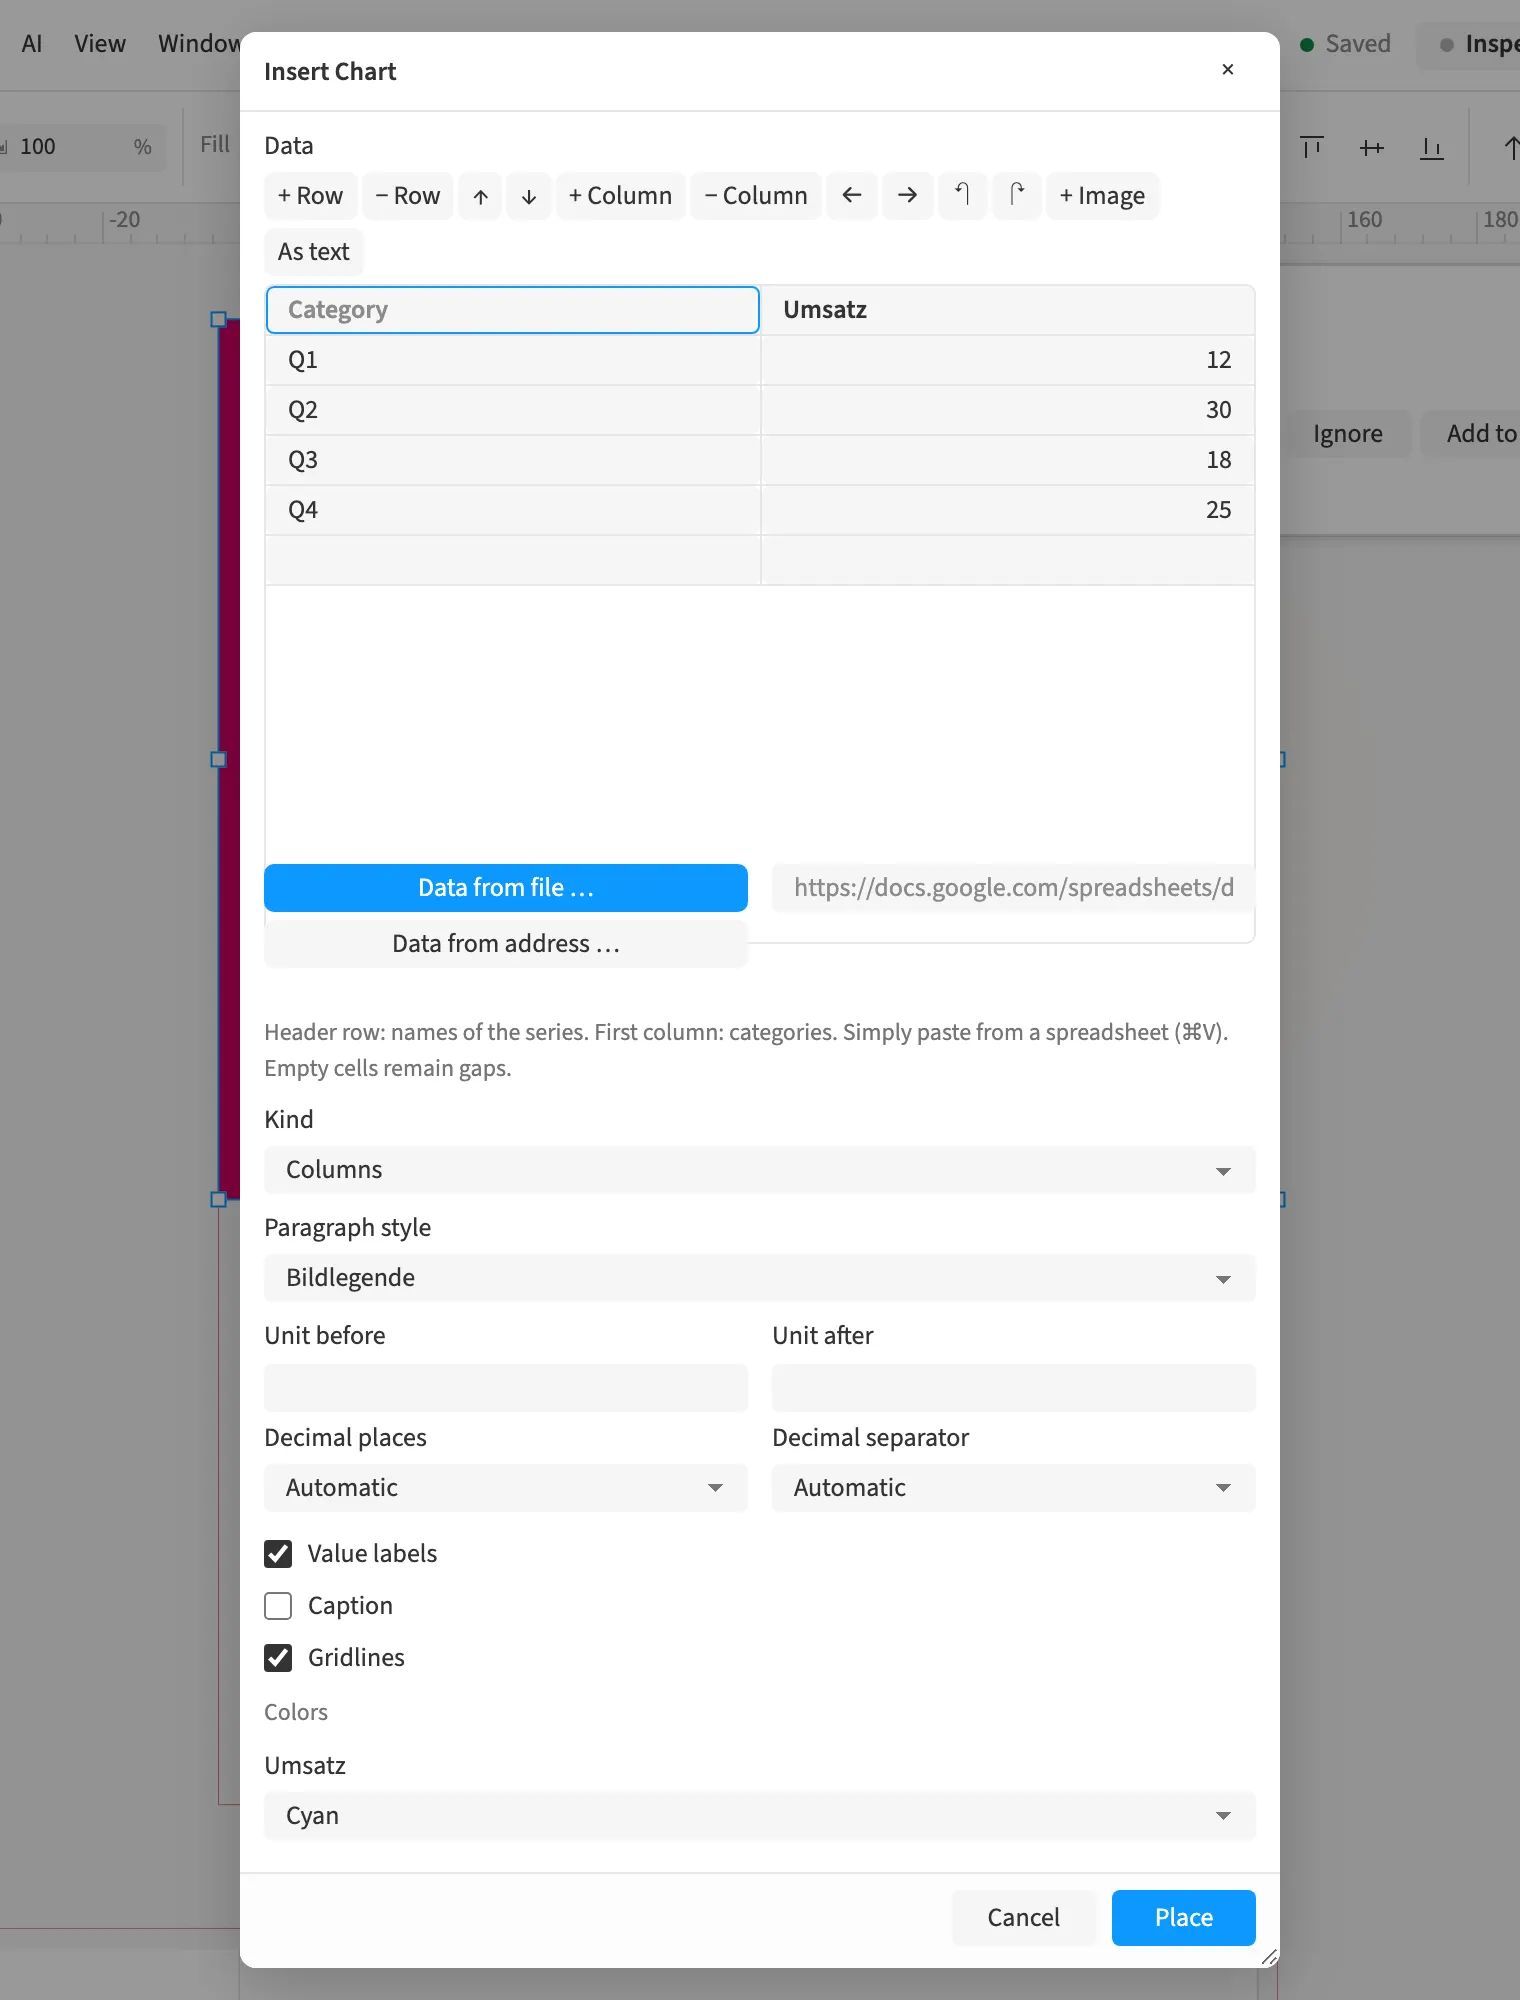
Where to find itObject › Place › Chart …
You generate column, bar, line, area, pie, doughnut or pictogram charts from numbers. In an annual report, you can also compare series stacked or as shares of 100 %. Charts use document swatches and remain editable as charts. They appear as vectors in the PDF, keeping lines and fills sharp when enlarged.
How to do it
- Open «Object» › «Place» › «Chart …».
- Choose the «Kind» and enter categories and numbers.
- Choose colours and labels and insert the chart.
Limits
Pie and doughnut charts show only the first data series.