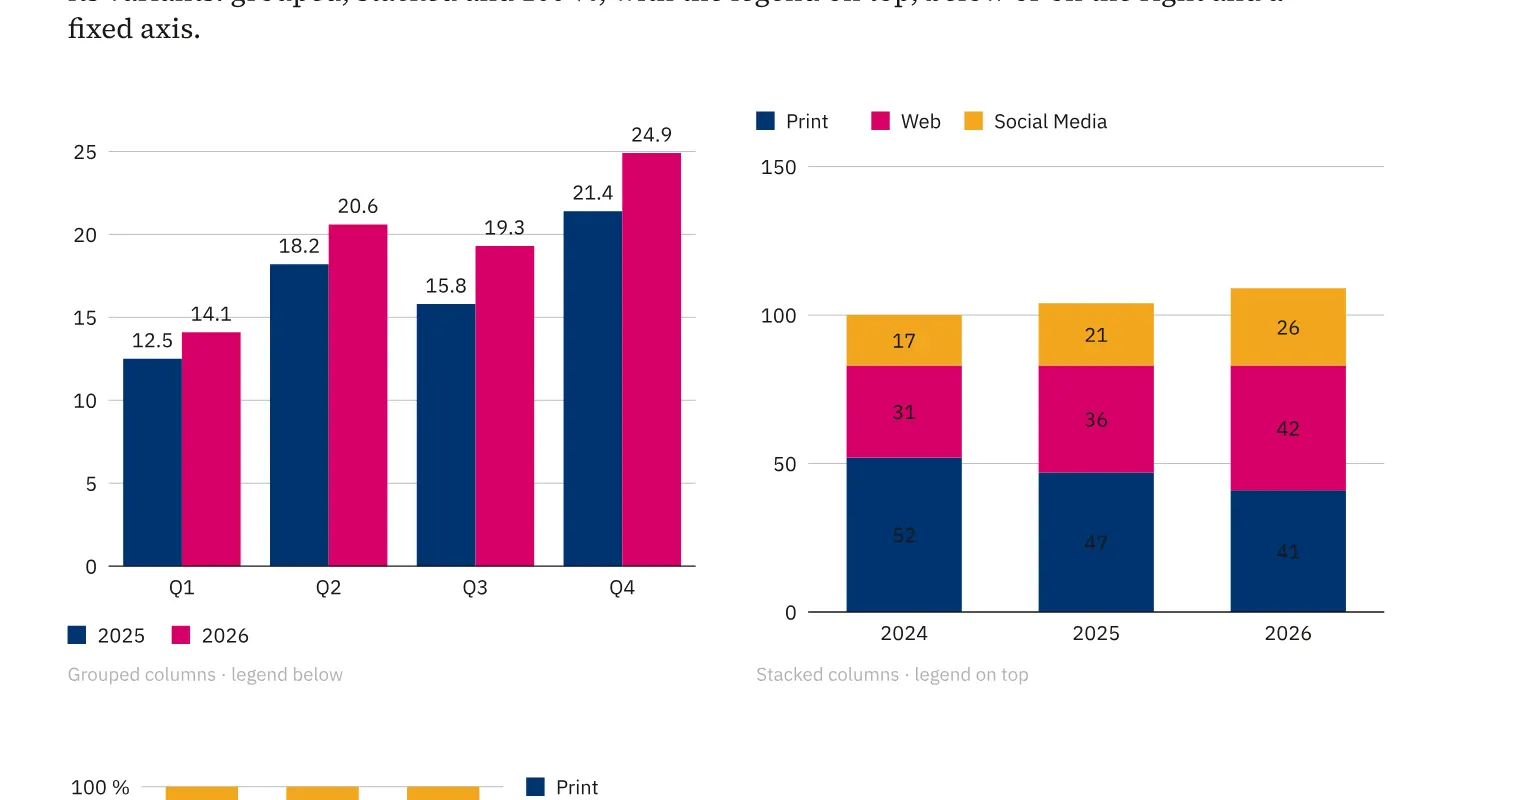
Where to find itObject › Place › Chart …
You enter chart data in a grid with rows and columns. For a magazine graphic, you can copy a range from Excel or Google Sheets and paste it into the grid. Tab and Enter move through the input, and a new row appears at the end. The same grid also serves org charts and node diagrams, with columns for their respective data.
How to do it
- Open «Object» › «Place» › «Chart …».
- Click the first target cell and paste the copied range.
- Add values with Tab and Enter and check the preview.
Tips
- In a selected data range, ⌘D fills down and ⌘↩ fills the range with one value.